
Integrating Obstruction Detection into an Aerodrome Mapping Database (AMDB)

Why Obstruction Detection Matters
A short introduction explaining that accurate obstruction data supports aerodrome safety and can be derived from terrain and surface models for AMDB integration.
The Core Data: DTM, DSM & DHM
| Dataset | Definition |
|---|---|
| DTM | Digital Terrain Model representing the bare-earth terrain surface. |
| DSM | Digital Surface Model representing terrain plus above-ground features. |
| DHM | Height-above-ground model derived by subtracting the terrain surface from the surface model: DHM = DSM − DEM/DTM. |
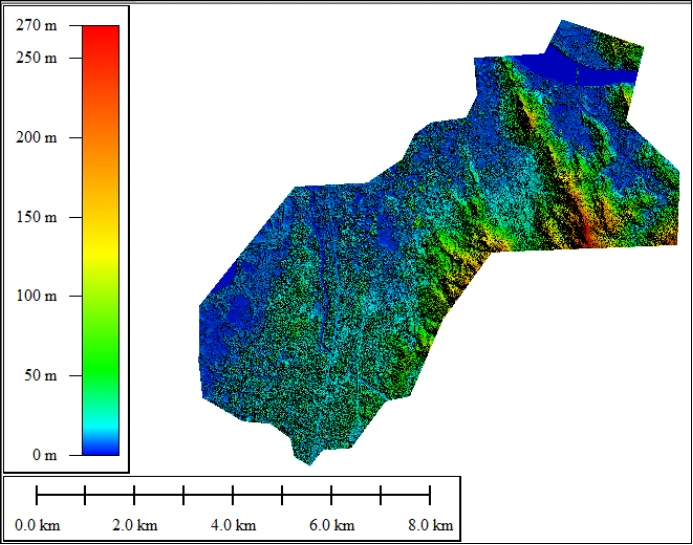
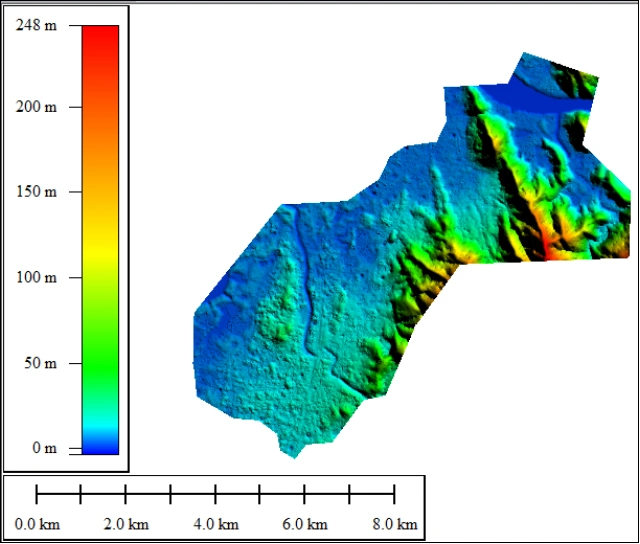
The DHM isolates features such as vegetation, buildings, towers and other vertical infrastructure from the underlying terrain.
Obstruction Detection Workflow
The DHM isolates features such as vegetation, buildings, towers and other vertical infrastructure from the underlying terrain.
- Data Ingestion : Co-registered DTM and DSM covering the aerodrome and surrounding obstacle-clearance areas. The methodology was tested using 1 m resolution DTM/DSM data.
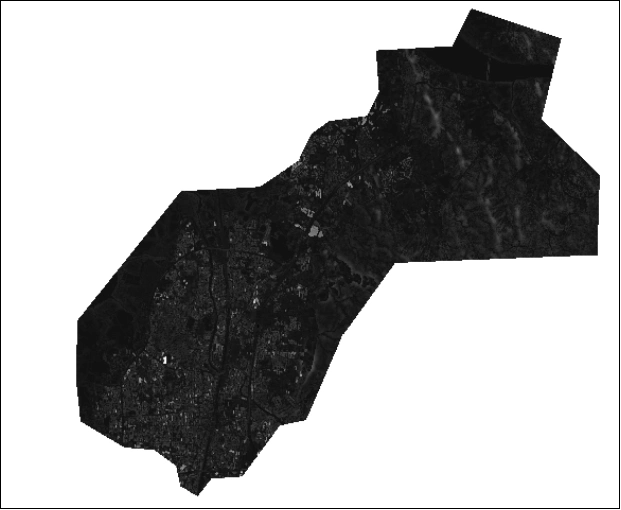
- DHM Generation : Digital Height Model (DHM) is computed as the arithmetic difference between the DSM and the bare-earth representation. DHM = DSM − DEM/DTM
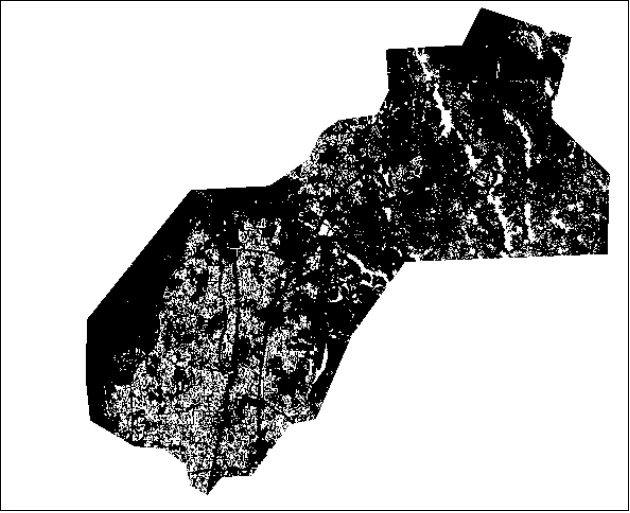
- Threshold Detection : Features with DHM ≥ 10 m are extracted as candidate obstructions.
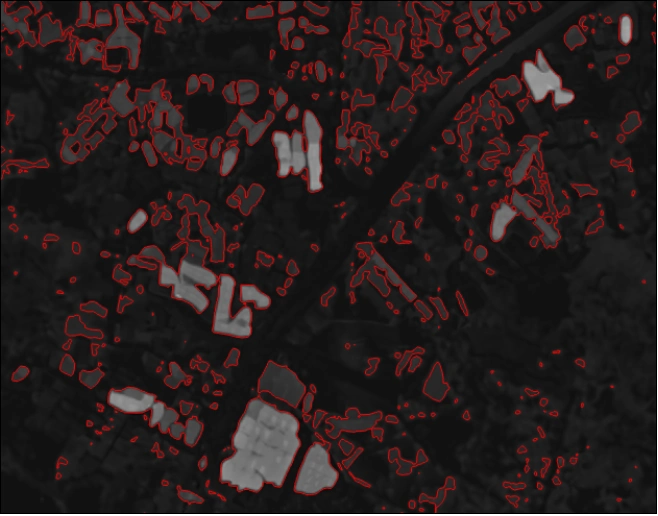
- Vectorization & Classification : Convert detected raster cells into polygon footprints and attribute them with estimated height, area and broad feature classification.
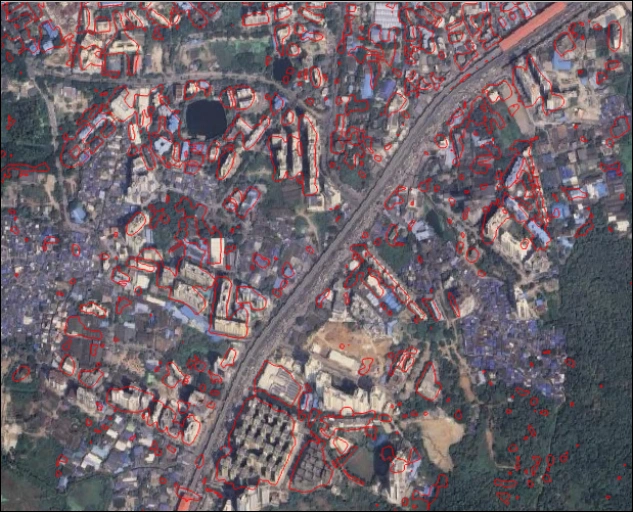
- Quality Control : Verify detections against high-resolution basemaps and supplementary DSM/DTM data, including temporal checks where acquisition dates differ.
- AMDB Integration : Map the extracted attributes into AMDB fields such as obstruction type, vertical extent, confidence, acquisition date/time and source resolution while retaining provenance metadata.
What the Workflow Produces
DHM Raster
Height-above-ground raster showing candidate obstructions.
Obstruction Footprints
Vector polygons containing height, area, feature class and detection confidence.
QC Imagery
Visual snapshots supporting verification of detected features.
Metadata
Source information, acquisition dates and processing details.
Why Integrate Obstruction Data with AMDB?
- Improved Situational Awareness
Visualize obstruction footprints and heights alongside aerodrome information. - Regulatory Compliance
Maintain a consistent obstruction layer for obstruction-limitation surfaces and monitoring requirements. - Automated Change Detection
Periodic DHM generation can identify newly erected structures and natural growth entering protected areas. - Risk Prioritization
Height, runway proximity and detection confidence can help prioritize field inspections or NOTAM-related action. - Scalability
Higher-resolution inputs improve the detection of smaller features.
Why 1 m Resolution?
This should be a large highlighted section, because it is one of the strongest points in the source material.
1 m Resolution enables:
- High spatial detail
- Detection of small and large features
- Improved identification of buildings, bridges, wind turbines and similar obstructions
- Sharper feature boundaries
- High overall accuracy in obstruction identification
Key Takeaway
Computing a DHM from co-registered DSM and DTM, applying a practical height threshold and vectorizing the detected features provides a practical pathway for generating obstruction datasets suitable for AMDB ingestion. The source case study identifies 1 m resolution inputs as materially improving the detection of smaller critical obstructions